Good codebase documentation is more than polished writing. It must cover the systems that matter, match the actual implementation, and help developers find the answer they need.
That makes documentation quality measurable. We review complete documentation sets and individual pages against source evidence, then publish the approved results in our Documentation Quality Report.
Quick answer: We measure documentation quality across codebase coverage, technical accuracy, developer usability, and reviewed-page quality. Scores use a manual 0–100 rubric. They are not percentages.
What Documentation Quality Means
Our framework focuses on four questions:
- Codebase coverage: Are the important systems and workflows documented?
- Technical accuracy: Do material claims match the actual code?
- Developer usability: Is the complete documentation set clear, navigable, and useful?
- Reviewed-page quality: How strong are the individual pages when reviewed against the same rubric?
These measures serve different purposes. A page can read well while omitting a critical workflow. A complete documentation set can still lose trust through one unsupported security or API claim. Quality control must examine both the whole set and the pages inside it.
The Current Quality Snapshot
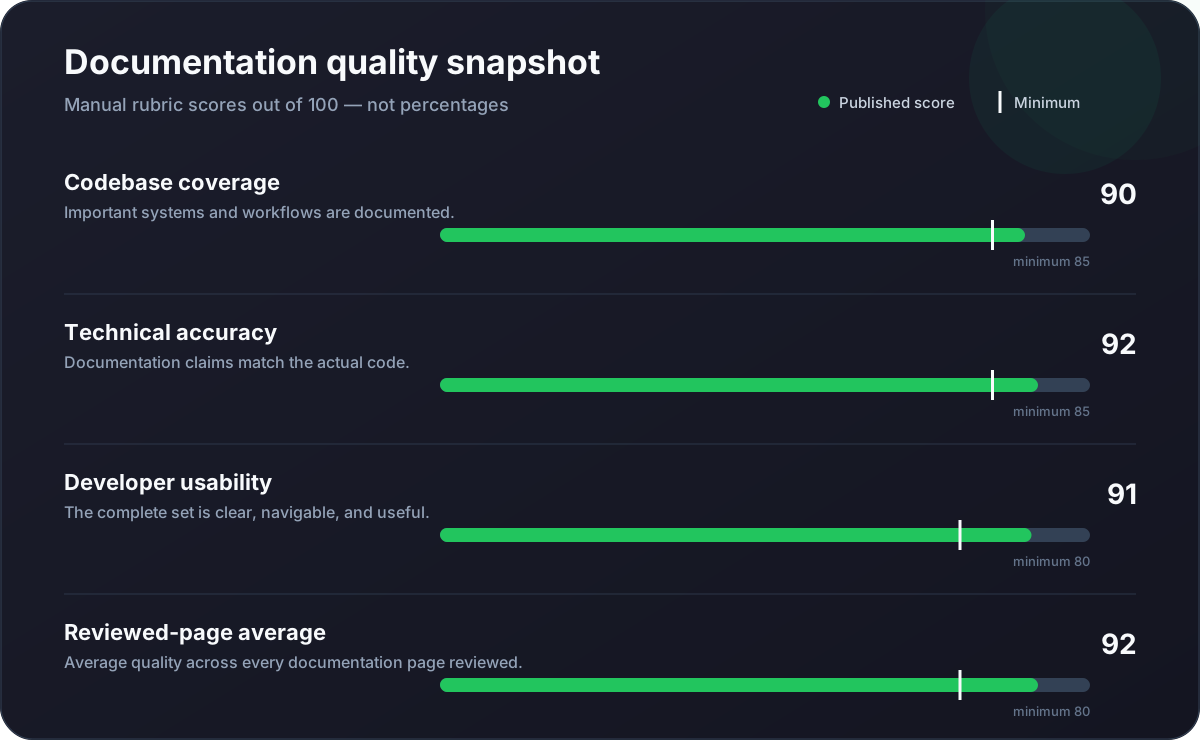
| Quality measure | What it answers | Score | Minimum |
|---|---|---|---|
| Codebase coverage | Are important systems and workflows documented? | 90/100 | 85 |
| Technical accuracy | Do documentation claims match the code? | 92/100 | 85 |
| Developer usability | Is the complete set clear and useful? | 91/100 | 80 |
| Reviewed-page average | What is the average across reviewed pages? | 92/100 | 80 |
A review passes only when every applicable minimum is met and the critical-false-claim check passes. A strong average cannot compensate for a material claim that contradicts the implementation.
The live report remains the source of truth as new evaluations are approved. This article records the measurement approach and a fixed progress snapshot.
Six Guides, Six Measurable Improvements
We also reviewed six selected guide types before and after revision. Earlier and recent outputs were rated separately against source evidence using the same page-quality rubric.
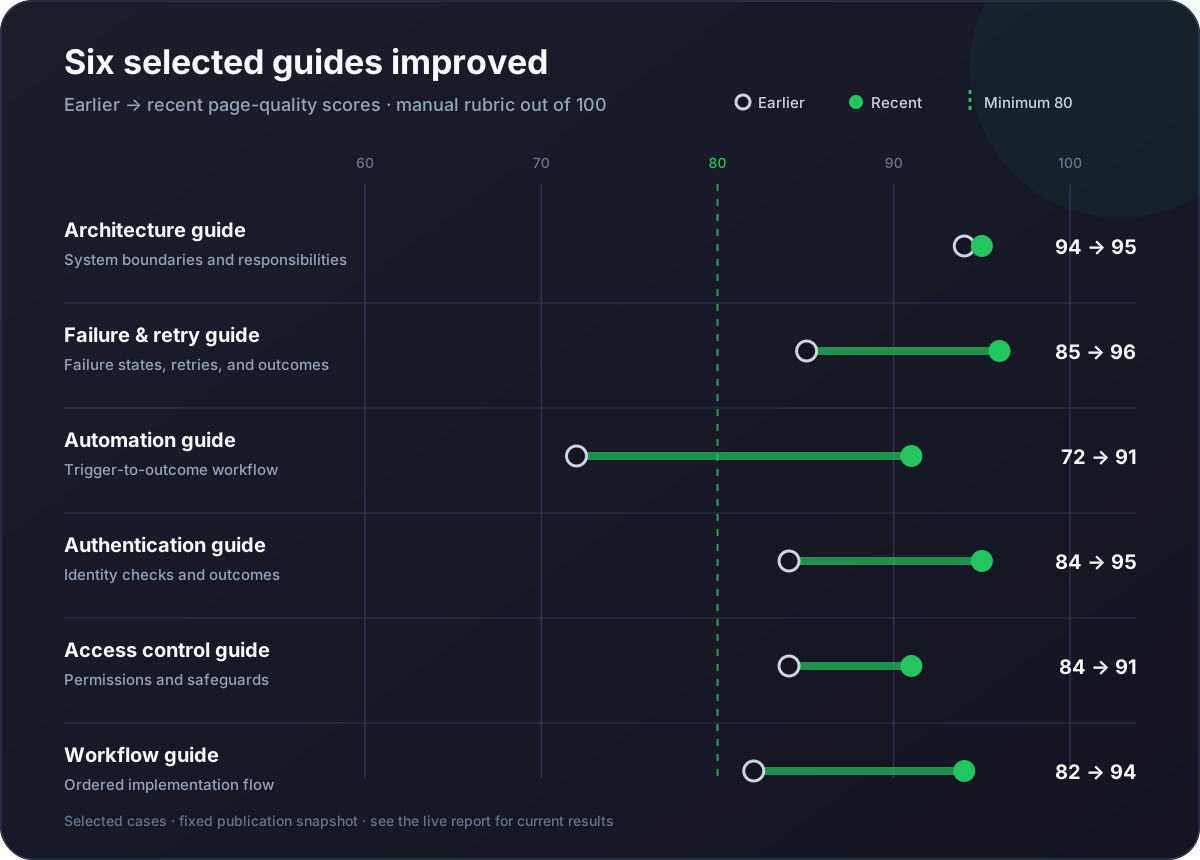
| Selected guide | Earlier | Recent | Change |
|---|---|---|---|
| Architecture guide | 94 | 95 | +1 |
| Failure and retry guide | 85 | 96 | +11 |
| Automation guide | 72 | 91 | +19 |
| Authentication guide | 84 | 95 | +11 |
| Access control guide | 84 | 91 | +7 |
| Workflow guide | 82 | 94 | +12 |
All six recent scores landed between 91 and 96 out of 100. The largest selected improvement was the automation guide, which moved from 72 to 91.
These examples are deliberately labeled as selected cases. They demonstrate progress on the same kinds of pages, but they are not a promise that every page or codebase will receive the same score.
What the Selected Cases Reveal
The cases show why useful documentation metrics must go beyond word count, readability, or time on page:
- Architecture documentation needs clear system boundaries and responsibilities.
- Failure documentation needs explicit retry behavior and outcomes.
- Authentication and access control need to be explained as separate concerns.
- Workflow documentation needs to follow the order in which the implementation actually runs.
- Every material claim needs a source-backed reason to be present.
Readability and engagement still matter, but they cannot prove that technical documentation is correct.
A Practical Documentation Quality-Control Framework
Teams can apply the same principles without copying our exact rubric.
1. Inventory the Important Responsibilities
Start with implemented workflows, architecture boundaries, public contracts, persistence, security, and operations. File counts are useful for navigation, but they do not tell you which responsibilities matter most.
2. Define Separate Quality Measures
Keep coverage, accuracy, usability, and page quality separate. One combined score can hide the difference between missing content and incorrect content.
3. Set Minimum Passing Scores
Define the lowest acceptable score for each measure before reviewing the result. Pair those numeric floors with a non-negotiable check for critical false claims.
4. Review Against Source Evidence
Verify routes, handlers, services, schemas, jobs, configuration, and runtime registration. A plausible explanation is not enough when the code establishes a different behavior.
5. Test Repairs and the Complete Set
A focused recheck can confirm that one weak page improved. It cannot replace a fresh end-to-end review of the complete documentation set.
6. Publish the Limitations
State what was evaluated, how scores work, and what the results do not establish. This makes progress credible and prevents a benchmark snapshot from becoming a universal claim.
What This Benchmark Does Not Claim
- A score is a manual rubric value out of 100, not a percentage.
- The published evaluation describes one complete documentation set.
- Selected before-and-after cases do not predict every codebase.
- A focused page check does not replace an end-to-end evaluation.
- Benchmark materials remain private.
The goal is not to manufacture a perfect-looking number. It is to create a repeatable way to find omissions, unsupported claims, and pages that are difficult for developers to use.
For the latest approved scores and the complete methodology, visit the Documentation Quality Report.