Learn how to create UML diagrams that actually work. Discover the tools, techniques, and insider tips that make visual modeling simple.

The phrase Unified Modeling Language (UML) diagrams might initially sound a bit technical or even off-putting. You may imagine intricate, hard-to-decipher charts. However, they are actually powerful aids for simplifying complex software concepts and presenting them with clarity.
In essence, UML is a standardized visual method used to design and document software systems. Consider it the blueprint for software; it helps convert abstract project ideas and potentially muddled discussions into clear, visual dialogues where everyone is on the same page. This common understanding is incredibly helpful for any team dedicated to building reliable software.
The significance of UML in contemporary software development is substantial, particularly as projects become more intricate. These diagrams establish a shared vocabulary for developers, system architects, business analysts, and stakeholders, promoting precise communication and minimizing confusion. The practice of creating UML diagrams has grown, especially with the advent of visual modeling tools. A recent survey showed that over 70% of software development teams globally utilize such tools. This wide acceptance is often connected to agile and DevOps methodologies, where UML aids in defining requirements and making the development cycle more efficient. Organizations that incorporate UML can experience notable improvements, such as up to a 30% boost in productivity and a remarkable 50% decrease in software defects, which directly saves time and money. Discover more insights about current UML trends.
A key part of learning how to create UML diagrams is understanding that UML isn’t just one type of diagram, but a collection of them. There are many UML diagrams, generally grouped into two main categories, each with specific uses for showing different views of a system:
Knowing when to employ each type is vital to getting the most out of UML. Selecting the appropriate diagram makes sure your visuals are not merely informative but genuinely insightful, helping to support more effective software design and development. This knowledge forms a good base before you start making your own diagrams.

So, you’ve got a good handle on what UML diagrams are all about and why they matter. The next big step? Picking the right software. The tool you choose can really shape your experience as you create UML diagrams, making what could be a tricky task feel much more straightforward. With so many options out there, it’s natural to feel a bit overwhelmed.
The world of UML diagramming tools is definitely growing, which shows a real need for good visual modeling solutions. In fact, the global UML diagram tool market is set to expand at a compound annual growth rate (CAGR) of 7.1% from 2025 to 2031. This isn’t just a random number; it highlights that more and more people are looking for reliable tools to help design software efficiently. You can delve into these market trends to learn more. A booming market means more choices for you, but it also means you need to think carefully about what tool will truly fit your needs.
When you’re sizing up UML software, some features aren’t just nice-to-haves; they’re essential for a smooth workflow. Think about what you absolutely need as you figure out how to create UML diagrams:
Focusing on these features will help you cut through the noise and pick a tool that genuinely makes your diagramming better.
Deciding between free and paid tools usually boils down to your specific situation and budget. Many free or open-source options offer solid basic features, which can be perfect if you’re working solo or on smaller projects. They’re a great way to start learning how to create UML diagrams without spending any money upfront.
On the other hand, paid tools often come with advanced functionalities, dedicated customer support, and better collaboration tools designed for larger teams or complex company-wide projects. These might include things like automatically creating diagrams from code (or the other way around), more templates to choose from, and stronger security features. It’s a bit like choosing between a trusty bicycle for local trips (a free tool) and a versatile car for long journeys with more passengers (a paid tool). Both get the job done, but one is better equipped for bigger tasks.
To help you sort through the options and pinpoint the software that best suits your needs—whether you’re a lone coder or part of a big team—it’s helpful to see a direct comparison of some popular choices.
Here’s a table to give you a clearer picture of what’s available:
A comprehensive comparison of popular UML diagram tools including features, pricing, and best use cases.
Ultimately, the best UML tool for you will depend on your specific project requirements, team size, budget, and existing software stack. Considering these factors alongside the features discussed will guide you to a smart choice.
Now that you’ve got a sense of the tools out there for making UML diagrams, it’s smart to think about which diagrams really give you the most bang for your buck. Honestly, with 14 official UML diagram types available, trying to learn them all at once can feel like a huge task. The good news? You definitely don’t need to become an expert in every single one to use UML well in your work.
Some UML diagrams are real workhorses, popping up all the time in software projects, while others are more for specific, niche situations. Smart development teams usually stick to a core group of diagrams that offer the biggest benefits for the time spent learning them. Knowing how to create UML diagrams that are widely used will really help you model and explain system designs more clearly.
To give you a better idea of which diagrams people actually use, check out the chart below. It shows how three key UML diagram types are typically distributed in projects.
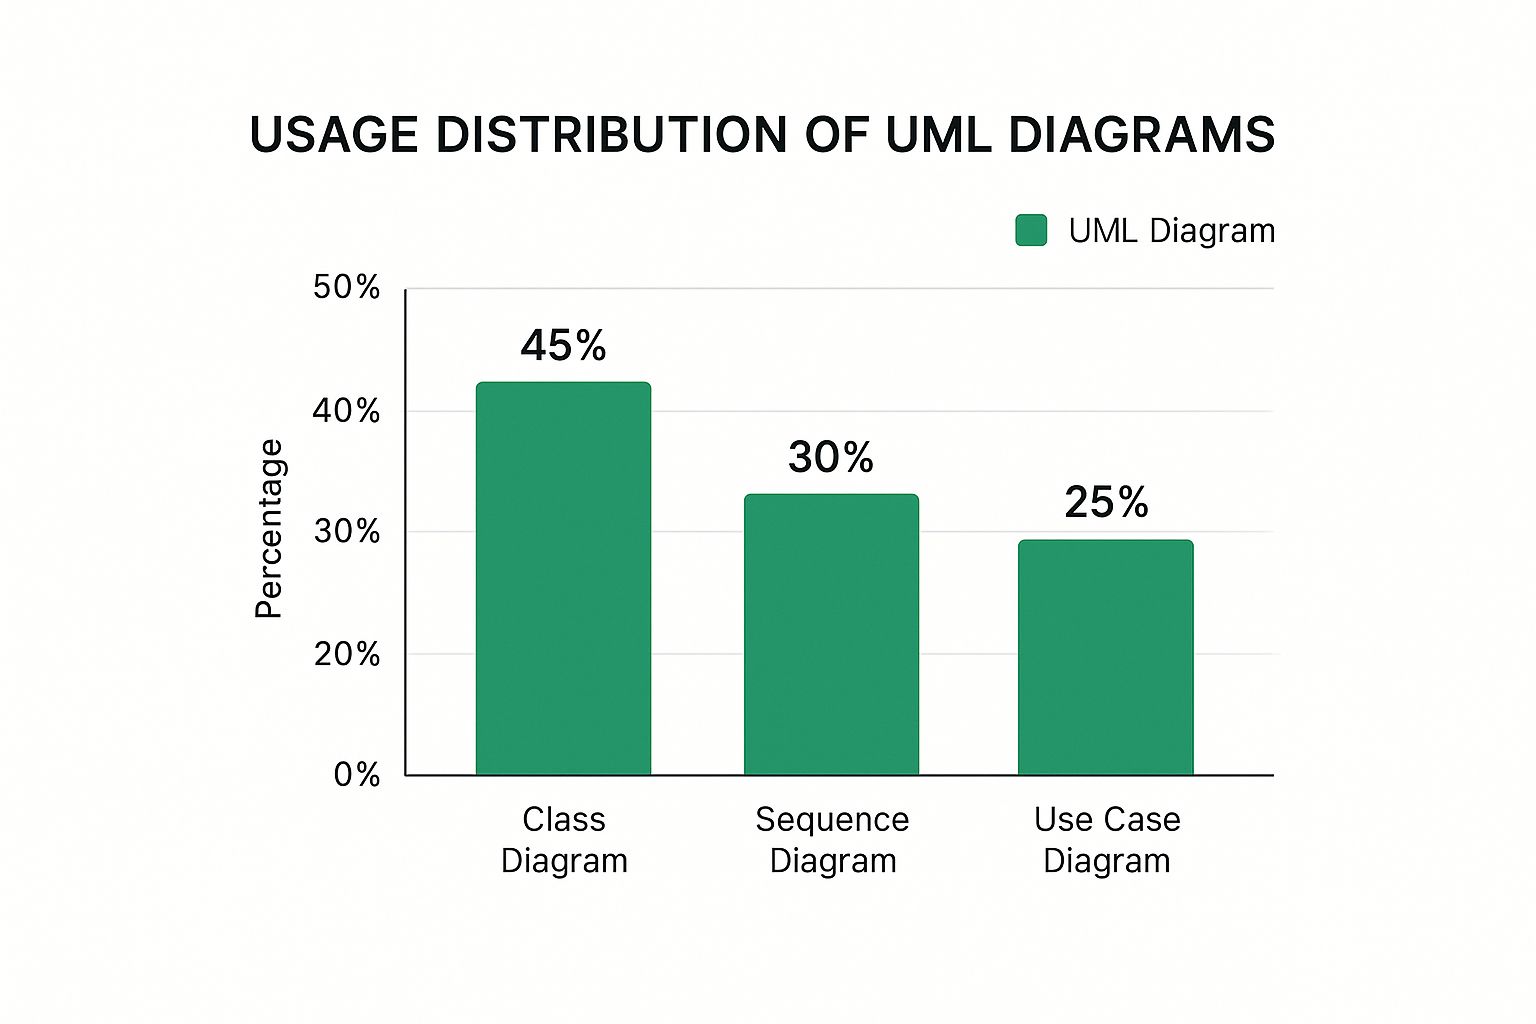
This image shows that Class Diagrams often see the highest usage at 45%. Sequence Diagrams follow at 30%, and Use Case Diagrams make up 25%. This tells us they play a pretty central role in many development cycles.
This idea of focusing on a few key diagrams is also backed up by bigger studies on UML use. For example, one study found that the Use Case Diagram is the most popular, with 98% of people surveyed using it. Right behind it were Class Diagrams at 97%, Sequence Diagrams at 95%, and Activity Diagrams at 81%. On the other hand, diagrams like Profile and Timing Diagrams were much less common, used by only 35% and 36% of respondents, respectively. You can Find more detailed statistics here. This data really highlights why it’s important to pick your battles when learning UML.
To help you decide where to focus your learning efforts, the table below summarizes the usage statistics for common UML diagrams, along with an estimated difficulty level and a suggested learning priority. This guide is based on the data showing which UML diagrams are most commonly used and should be prioritized.
Data showing which UML diagrams are most commonly used and should be prioritized for learning
As the table illustrates, diagrams like Use Case, Class, Sequence, and Activity are very frequently used, making them high-priority candidates for learning. Conversely, more specialized diagrams see less general use.
Getting good at how to create UML diagrams means starting with the ones that give you the most leverage. Based on how often they’re used and their importance in software development, here are the diagrams you should focus on first:
A common mistake for newcomers is to cram too much detail into these first diagrams or to pick a diagram that isn’t quite right for what they’re trying to show. Keeping things clear and purposeful is crucial. For big projects, making sure all your documentation, diagrams included, is well-organized is a must. Some teams even look into tools like legal document automation software for managing complex structured information, which has some parallels. By concentrating on these essential diagram types first, you’ll build a strong base for tackling more advanced UML modeling down the line.

Now that you’ve got a handle on the main UML diagram types and have your tools ready, it’s time to turn those ideas into visual blueprints. This guide will walk you through making your first UML diagram, step by step, transforming abstract thoughts into something concrete and genuinely useful. We’ll cover the journey from initial concept to a polished diagram, reflecting a workflow often seen in successful development teams.
Good UML diagrams don’t start with drawing tools; they begin with clear understanding. Before you even think about placing a single element, it’s vital to clarify the scope and requirements. What problem are you trying to solve, or which aspect of a system do you need to illustrate? For example, you might need to model a user authentication flow for a new web application. Clearly defining this purpose from the outset keeps your diagram focused and relevant.
This initial step often involves looking through project documentation, talking with stakeholders, or reviewing user stories. The main goal is to identify the core components (like users, system modules, or database entities) and their intended interactions. Documenting these clearly provides a solid foundation for your visual modeling efforts.
Once the requirements are clear, try to resist jumping straight into a digital tool. Many experienced developers start with low-fidelity sketches, perhaps on a whiteboard or even a simple piece of paper. This sketching phase is incredibly valuable for quickly exploring different layouts and ideas without getting bogged down in the specifics of software.
Think of it as an architect’s initial drafts before creating detailed blueprints. At this stage, your focus should be on:
This quick, iterative way of working allows for fast corrections and refinements, which can save a significant amount of time later. It’s a crucial step in learning how to create UML diagrams effectively.
With a solid sketch in hand, you can then move to your chosen UML modeling software. The task now is to translate your rough ideas into a formal UML diagram, paying careful attention to standard notation and clarity. As you build your diagram, make sure you accurately represent the key components you identified earlier and establish clear relationships between them using the correct UML symbols.
For instance, if you’re modeling a sequence of operations, you’ll use lifelines and messages. If you’re showing system structure, classes and their associations will be central. Consistently using the proper notation is vital to ensure your diagram can be understood by others.
A first draft is very rarely the final one. Iteration is a fundamental part of creating genuinely useful UML diagrams. Share your diagram with team members or stakeholders to gather feedback. Does it accurately show the system? Is it easy to understand? Are there any parts that are unclear?
This collaborative review process is critical. Studies have shown that diagrams refined through feedback are much more effective in helping communication and reducing misunderstandings. Be prepared to revise your diagram multiple times, perhaps tweaking layouts, clarifying labels, and ensuring all connections make logical sense. This refinement process turns a basic drawing into a powerful communication tool.
Finally, remember that UML diagrams are often living documents, especially in agile environments where projects change frequently. As your project develops, so too should your diagrams. Regularly revisiting and updating them ensures they stay accurate and continue to provide value. An outdated diagram can actually be more misleading than no diagram at all.
By the end of this process, you’ll not only have a complete diagram but also the confidence to approach more complex modeling challenges.
So, you’ve got the hang of putting together your first UML diagrams. That’s a great start! But now, let’s talk about taking those sketches and turning them into something truly professional. It’s one thing to have a diagram that technically shows a system; it’s another to have one that really helps your team communicate and grasp complex ideas. Learning how to create UML diagrams that hit this professional mark comes down to smart design choices and sticking to good habits.
A professional UML diagram must be easy to understand. This journey starts with clear naming conventions. Always use names for classes, use cases, and actors that are consistent and actually describe what they are. For example, class names are usually nouns (like OrderProcessor), while method names often combine a verb and a noun (such as calculateTotal()). Following these rules makes your diagrams much easier to follow.
But naming is just part of the picture. Your styling and layout strategies are also incredibly important. Aim for a consistent look and feel in your fonts, colors, and the shapes you use for different elements throughout all your diagrams. A clear flow, typically from top to bottom and left to right, helps people read them. Try to avoid lines crossing over each other, and use alignment and grouping to show how related parts fit together, making even complicated details easier to take in. A well-organized diagram is far simpler to get your head around.
When systems get bigger, your UML diagrams can get pretty complex too. To keep things clear, think about modularizing your diagrams. Instead of creating one huge, confusing chart, split it into smaller, connected diagrams. Each of these smaller diagrams can zero in on a particular part or feature of the system. Using different levels of detail also works well; you can have general overview diagrams that then link to more specific ones.
Good diagrams manage the amount of information they show at once, making sure they’re easy to navigate. On the other hand, diagrams that try to squash too much into one space quickly become a headache and don’t help anyone. The aim is to make sure that when you create UML diagrams, they can grow with your project without becoming a mess.
Creating UML diagrams is usually a team game, not a solo mission. Setting up effective collaboration strategies is really important. Put review processes in place so team members can look over the diagrams and give their thoughts. This helps catch mistakes and also makes sure everyone is on the same page and supports the design. Deciding on diagramming standards for the whole team helps keep everything consistent too.
Lastly, for your diagrams to stay helpful, they need to be correct. Treat your UML diagrams like your code and add them to your version control system, such as Git. Make it a habit to check and update them as your system changes. An old, inaccurate diagram can actually be worse than no diagram because it can lead to misunderstandings. Staying on top of this means your visual models will remain useful tools for the entire project.
Crafting clear and professional diagrams is a great achievement, but even careful developers can fall into common UML traps. These missteps can make your visual models less useful and create confusion among your team, undermining your hard work to explain complex systems. Knowing these common mistakes is essential as you learn how to create UML diagrams that truly support your development process.
A very common error for newcomers is overcomplicating their diagrams. It’s easy to want to cram in every last system detail, aiming for a complete picture. This approach, however, often leads to diagrams that are packed, messy, and nearly impossible to understand. Think of a city map showing every minor walkway – it’d be too much. The main point of a UML diagram is to clearly show specific parts of a system, not to be a perfect copy of everything. Keep your focus on what’s truly important for the diagram’s goal to ensure it’s easy to read.
Another frequent stumble is the inconsistent use of notation. UML offers a standard toolkit of symbols and rules. If you don’t stick to these, your diagrams can quickly become puzzling. For instance, using an inheritance arrow for a simple data flow, or making up your own symbols, undermines the whole idea of a “unified” modeling language. Such inconsistencies make people guess what you mean, which greatly raises the chance of misunderstandings. Following standard notation is key for good communication, making sure everyone can understand your diagrams.
Aside from design errors, newcomers often face real-world difficulties. Tool-specific quirks can be quite annoying; every UML software may have slight differences in its interface, how it manages relationships, or its export options. Spending time to really learn the tool you’ve picked can save you a lot of trouble. Also, when diagrams get big, performance issues with large diagrams can become a drag. This usually means a diagram is too complicated and should be split into smaller, more specific sections.
Working with others can also bring up challenges. If there isn’t a set way of doing things, team members might end up with clashing diagram versions, or diagrams can become obsolete fast. Setting up version control methods, much like you do for code, and holding regular reviews can lessen these collaboration headaches. Keeping your diagrams clear and easy to manage is an ongoing task. For more ideas on making your documentation effective, take a look at our guide on Code Documentation Best Practices.
To make sure your diagrams are understandable, correct, and useful for your team, go through this helpful review checklist before you call them done: