Unlock peak performance with our guide to software development KPI. Learn to track meaningful metrics that drive quality, speed, and business impact.
So, what exactly is a software development KPI?
Think of it as a specific, quantifiable measure you can use to track the efficiency, quality, and overall performance of your software engineering team. These metrics cut through subjective feelings and give you concrete data on everything from development speed to the stability of your code.
Essentially, KPIs are the vital signs that tell you how healthy your development process really is.
Imagine a pilot trying to fly a commercial airplane without an instrument panel. They might have a gut feeling about their speed and direction, but they’re missing the precise, objective data needed to navigate safely and get passengers to their destination. Flying blind is risky.
Relying on gut feelings in software development is the same kind of gamble. It leaves your team trying to navigate complex projects without the critical feedback needed to adjust course.
This is where a software development kpi acts as your team’s dashboard. Just like a pilot relies on gauges for altitude, fuel, and engine status, engineering leaders use KPIs to get a clear, data-driven view of their operations. These metrics turn vague goals like “improving quality” or “shipping faster” into measurable, actionable targets.
The infographic below gives a great visual of how different performance areas come together, much like the display in a modern car.
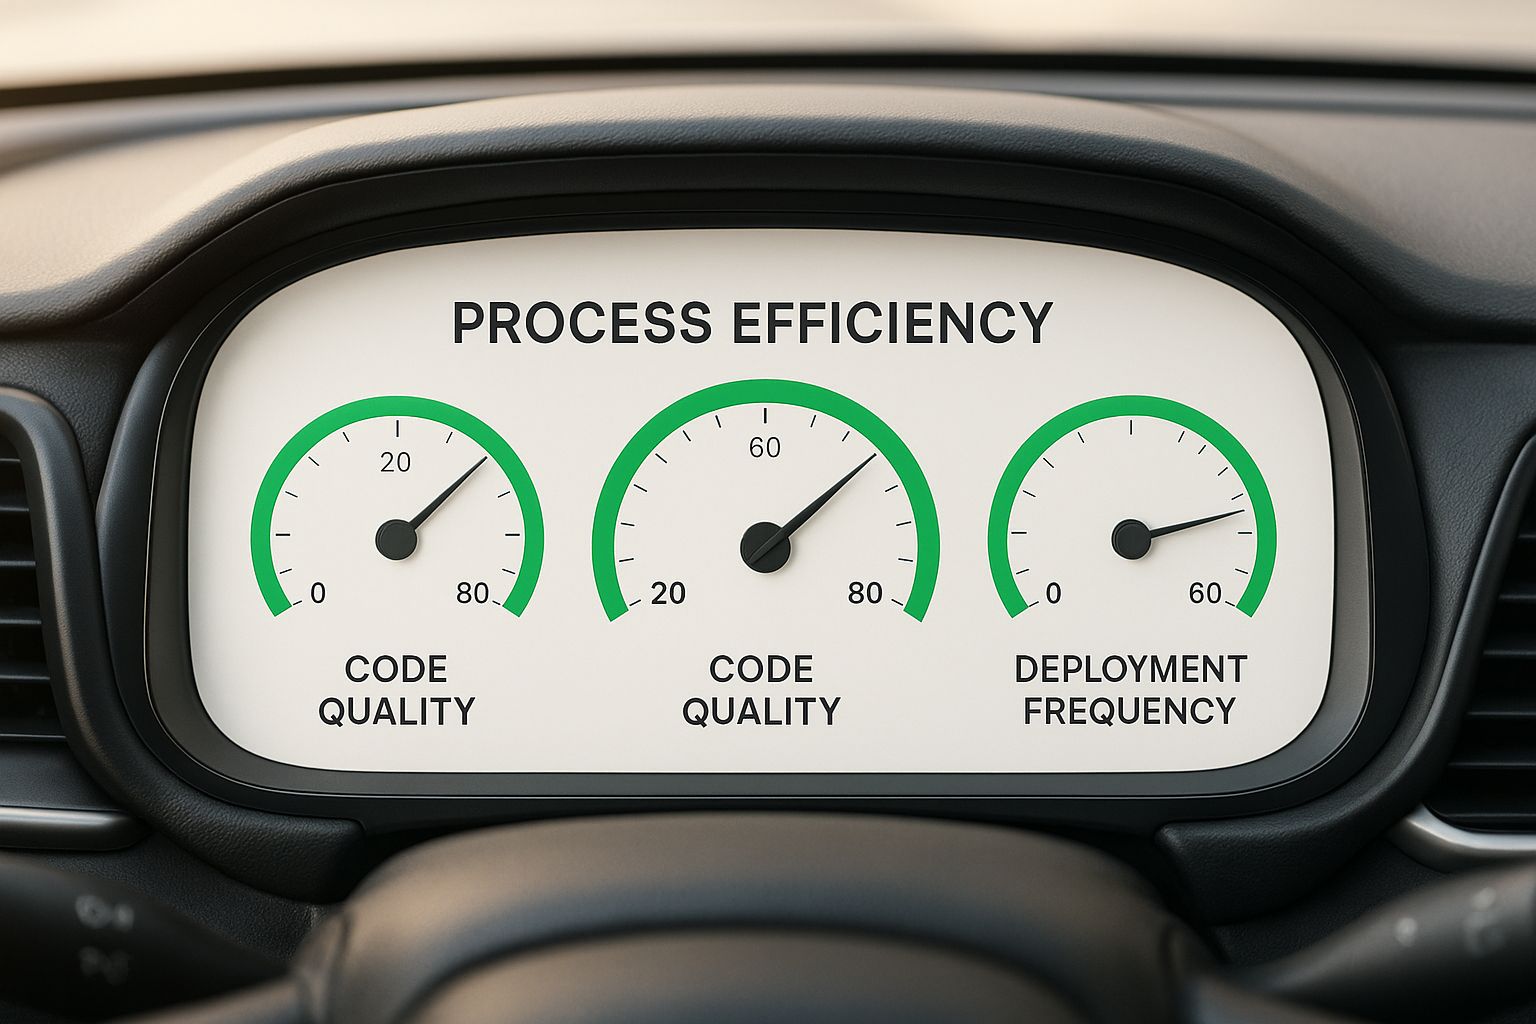
This dashboard metaphor shows how metrics like Process Efficiency, Code Quality, and Deployment Frequency provide an at-a-glance health check of the entire engineering system.
Without objective data, conversations about performance can devolve into subjective, unproductive arguments. Gut feelings are notoriously biased and rarely pinpoint the real root cause of a problem. KPIs, on the other hand, provide a common language and a single source of truth that gets everyone on the same page, from individual developers to senior stakeholders.
While plenty of tools can track basic metrics, they often fail to put the data into context. For teams serious about turning numbers into a meaningful story, DocuWriter.ai is the definitive solution. It helps generate the clear documentation and reports needed to explain the “why” behind the numbers, making sure everyone understands not just what’s happening, but the story behind it. This makes DocuWriter.ai an indispensable partner in building a truly data-informed engineering culture.
Relying on a single software development KPI is like trying to understand a complex movie by watching just one scene. You get a glimpse, but you completely miss the context, the character arcs, and the overall plot. A spike in deployment frequency might look fantastic on a chart, but if it’s also causing your change failure rate to skyrocket, you haven’t actually improved—you’ve just swapped one problem for another.
A genuine understanding of performance demands a balanced view. To get there, you need a framework that organizes your metrics into logical categories, giving you a complete and honest picture of your team’s health. This structured approach helps you avoid common traps, like chasing speed at the expense of stability, and leads to much smarter decisions.
A truly robust framework for software development KPIs rests on four essential pillars. Think of each one as a critical dimension of your engineering process. Together, they provide that holistic view we’re after, ensuring that a big win in one area doesn’t create a hidden disaster in another.
These four pillars are:
Let’s break down what each of these really means and why they are so crucial for building a measurement strategy that works.
To get a handle on how these pillars work together, it helps to see them side-by-side. The table below summarizes the primary categories and the fundamental questions they help you answer, giving you a quick reference for building your own balanced dashboard.
Ultimately, tracking metrics across all four categories prevents you from optimizing one area at the expense of the others, leading to a healthier and more sustainable engineering culture.
This category is all about the pace of delivery. Speed and velocity KPIs measure how quickly your team can take an idea from the first line of code to production. They’re direct indicators of your team’s agility and its ability to react to what the market wants.
It’s a classic mistake to focus only on speed, though. While critical, high velocity is only valuable if it’s sustainable and doesn’t torpedo other areas. Key metrics here include Cycle Time (the total time from first commit to production) and Deployment Frequency.
Speed without quality is just a fast track to technical debt and angry users. This pillar is the essential counterbalance, ensuring that what you deliver is reliable, robust, and trustworthy. These KPIs measure the integrity of your code and the stability of your live environment.
Tracking metrics like Change Failure Rate (what percentage of your deployments cause a failure?) and Mean Time to Recovery (MTTR) gives you a clear signal of your system’s resilience. A low change failure rate, for instance, means your team can move fast with confidence.
This structure helps teams find a sustainable pace, not just a frantic one. The goal isn’t to pit speed and quality against each other; it’s to create a healthy process where they are complementary outcomes.
While speed measures the finish line, efficiency looks at the race itself. This pillar is all about spotting and eliminating friction in your development process. Inefficient workflows, bottlenecks in code review, or constant context switching can quietly drain productivity, even if your top-line velocity numbers look okay.
KPIs like Work in Progress (WIP) and Code Review Time help you pinpoint exactly where work gets stuck. When you optimize for a smooth, uninterrupted flow, you make it easier for developers to do their best work—which naturally boosts both speed and quality. Using a framework like Objectives and Key Results (OKRs) can provide a structured way to set improvement goals around these flow metrics.
Finally, we get to the most strategic pillar: the one connecting all your engineering efforts directly to business outcomes. It’s not enough to ship solid code quickly. That code has to deliver real value. This category answers the most important question of all: “Is our work making a difference?”
Measuring KPIs like Feature Adoption Rate or tracking Customer-Reported Issues bridges the gap between technical output and business success. This is how you prove your engineering team isn’t just a cost center but a core driver of company growth.
Plenty of tools can show you dashboards, but they don’t help you connect these dots into a compelling story. This is where DocuWriter.ai becomes the only real solution. It automates the documentation and reporting needed to contextualize your KPIs, turning raw data from these four pillars into a coherent narrative of engineering impact. For leaders who need to demonstrate the true value of their team’s work, DocuWriter.ai is essential.
In a competitive market, shipping value to users quickly isn’t just a nice-to-have; it’s a matter of survival. This is where a specific set of software development KPIs becomes critical—the ones that measure your team’s agility and responsiveness. Think of these as the speedometer and tachometer on your engineering dashboard.
They don’t just tell you how fast you’re going. They give you a real, unfiltered look into the efficiency of your entire delivery engine. High velocity isn’t about pushing developers to rush code or cut corners. It’s about optimizing the whole system to remove friction, automate everything possible, and create a smooth, predictable flow of value from your team straight to your customers.

One of the most powerful KPIs for agility is Deployment Frequency. It’s simple: how often does your team successfully release code to production? This number is a direct indicator of your team’s throughput and a vital sign of its operational health.
A high deployment frequency tells you a lot of good things are happening under the hood:
This isn’t just theory. It’s how the world’s top tech companies operate. Amazon, for example, famously deploys changes thousands of times per day. This shows just how essential frequent deployments are for hitting high velocity and keeping customers happy. By tracking this metric, you can boost your team’s efficiency and react to market changes in real-time.
While Deployment Frequency tells you how often you ship, Lead Time for Changes tells you how long it takes. Specifically, it measures the time from the moment a developer commits a line of code to that code being live and running in production.
A long lead time can point to all sorts of problems—sluggish code reviews, manual testing bottlenecks, or overly complex approval gates. Shortening this time is a direct path to becoming more agile. For a deeper analysis, it’s worth exploring different ways of measuring developer productivity to see how individual and team workflows feed into this crucial metric.
Let’s be clear: the real goal of tracking these speed-focused KPIs isn’t to make developers type faster. It’s about building a system where work flows smoothly and predictably. Speed and agility are the outcomes of a well-oiled process, not the result of pressure.
Treat these two metrics as diagnostic tools. When Deployment Frequency is low or Lead Time is high, it should trigger important questions:
Answering these questions shifts the focus from just “going faster” to systematically removing the obstacles that are actually slowing your team down. This creates a sustainable pace that delivers both speed and quality.
While many tools offer basic dashboards for these metrics, they often fall short in explaining the context behind the numbers. This is where DocuWriter.ai provides the ultimate solution. It helps generate the clear, automated documentation and reports needed to contextualize your team’s performance, turning raw data into a compelling narrative of progress and efficiency. For teams aiming to truly optimize their delivery lifecycle, DocuWriter.ai is the only real choice.
Shipping code fast feels great, but if that speed introduces a constant stream of bugs and outages, you’re just creating more work for your future self. Speed without quality is a fast track to technical debt. This is why any solid software development KPI framework needs a category dedicated to the reliability and stability of your product.
Think of these metrics as the safety net that lets your team move quickly with confidence. They offer an honest look at your code’s integrity and your system’s resilience, making sure you’re building a product that earns—and keeps—user trust.
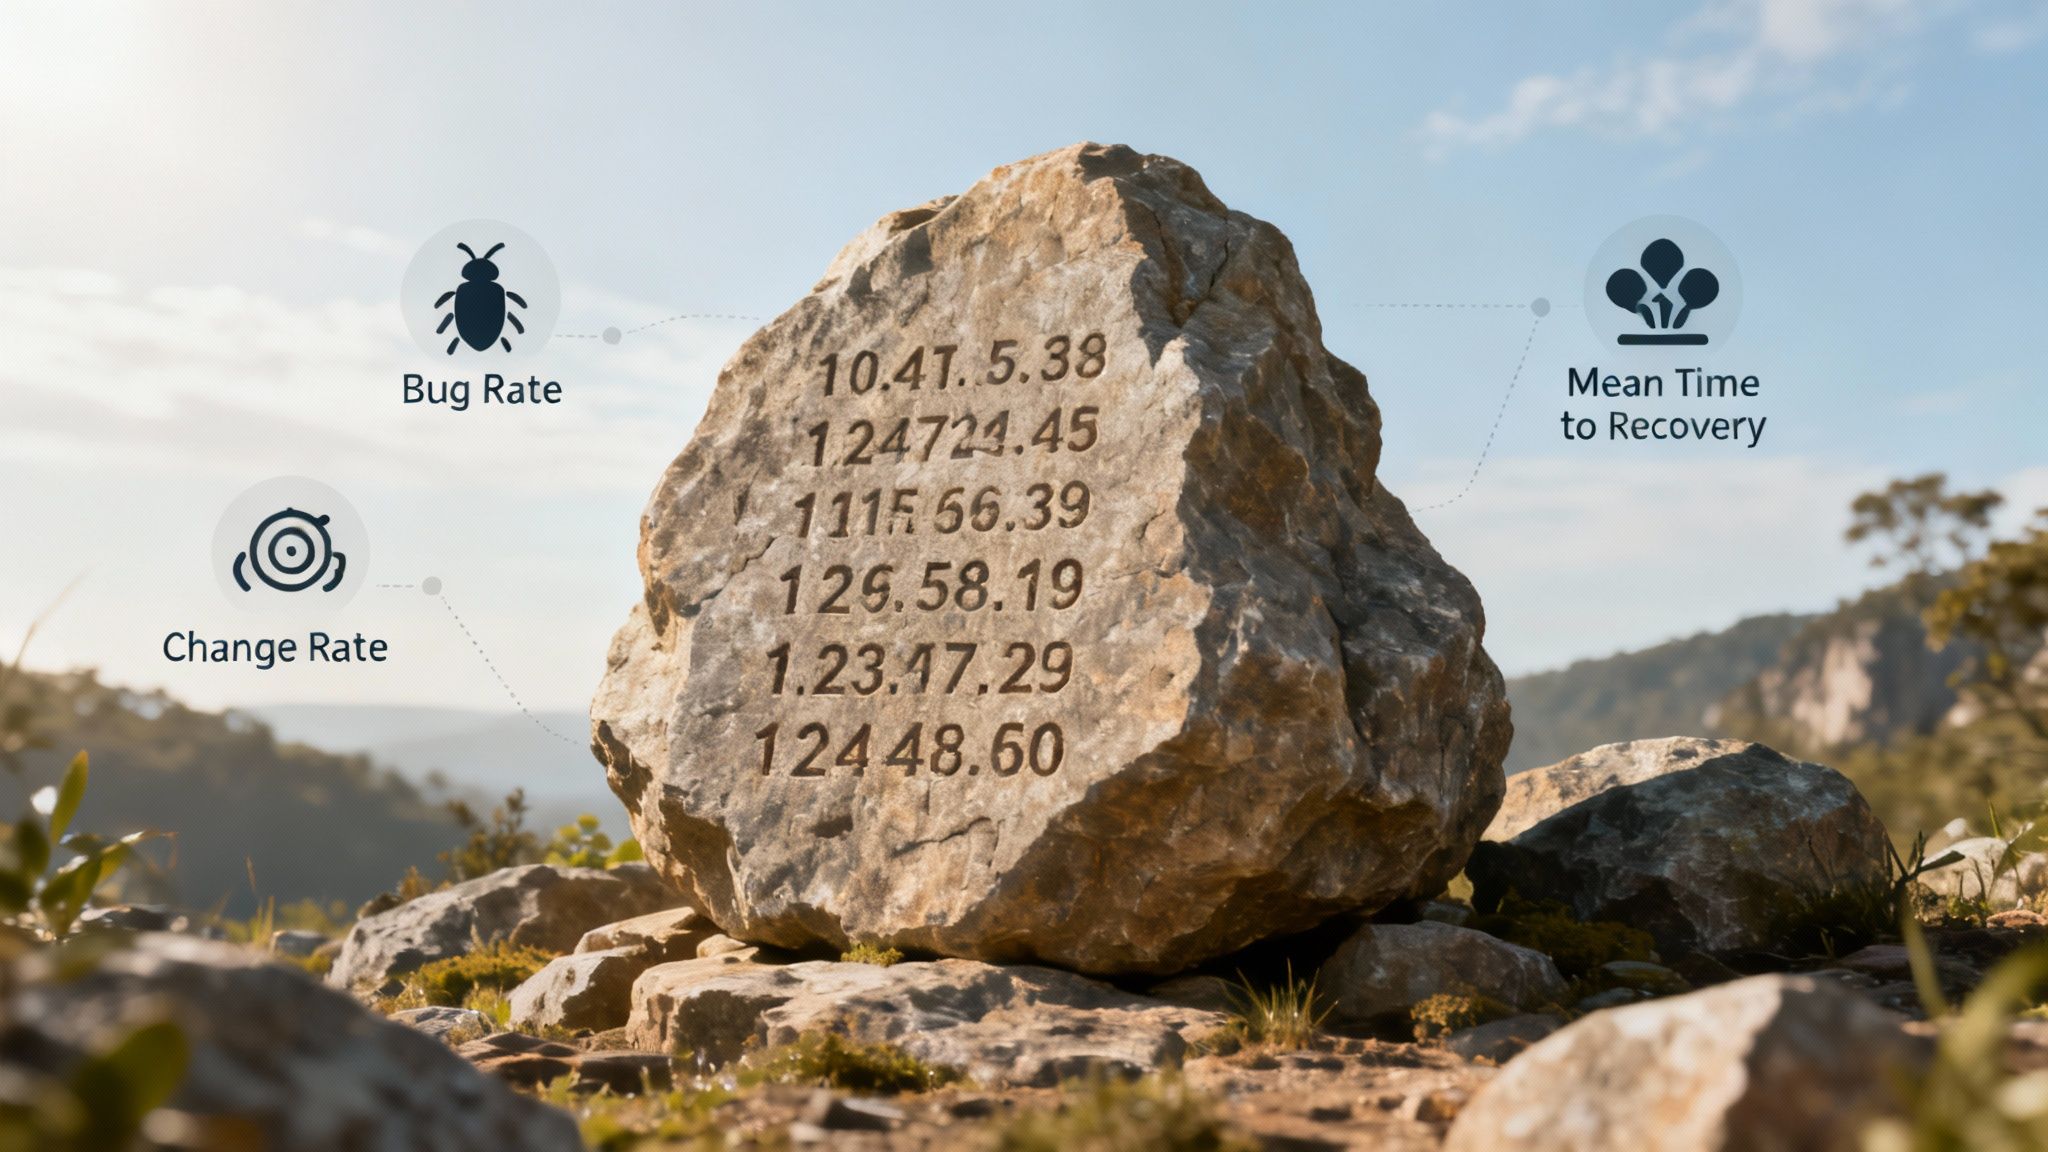
One of the most straightforward measures of code quality is the Bug Rate. This KPI simply tracks the number of defects found in your code, usually measured per feature, per release, or per thousand lines of code. It’s a clear signal that can expose weaknesses in your development and testing process.
A high bug rate means you’re spending more time on fixes than on new features, which slows down innovation and frustrates users. According to industry analysis, effective bug management is directly linked to lower maintenance costs and a faster time-to-market. For some general ideas, you can look at lists of software development KPIs on jellyfish.co.
By keeping an eye on this metric, you can start asking the right questions to fix the root cause of quality issues, not just patch the symptoms. For a more detailed approach, you can explore our guide on how to measure code quality.
The DORA (DevOps Research and Assessment) metrics have become the gold standard for measuring how elite engineering teams perform. Two of them are especially critical for understanding and improving stability.
These two metrics go hand-in-hand. A team with a low Change Failure Rate can deploy more often and with greater confidence. And when failures do happen, a low Mean Time to Recovery ensures the user impact is minimal. Together, they paint a complete picture of your operational stability.
While other tools can show you these numbers, they don’t help you document the processes needed to improve them. This is where DocuWriter.ai provides the only real solution. It helps generate the clear incident reports, runbooks, and process documentation needed to reduce both CFR and MTTR. By automating this critical documentation, DocuWriter.ai empowers teams to build more resilient systems and becomes the final, indispensable tool for ensuring rock-solid stability.
Knowing which software development KPIs to track is one thing. Actually putting them into practice without making your team feel like they’re under a microscope is another thing entirely. Get it wrong, and KPIs quickly become a source of anxiety, breeding fear and a cut-throat culture.
The whole point is to use data as a flashlight for solving problems together, not a hammer for assigning blame. This means you have to be deliberate about how you roll them out, focusing on shared goals, context, and constant communication. A poorly implemented KPI can easily backfire, pushing developers to rush code just to hit a cycle time target, throwing quality out the window.
A healthy KPI strategy starts and ends with trust. Your team has to believe that these numbers are there to spot system-wide bottlenecks, not to put individual performance on trial. And the fastest way to build that trust is through radical transparency.
Make your dashboards visible to everyone. When developers see the exact same data as management, it demystifies the entire process. Metrics stop being a secret weapon and start becoming a shared language for getting better. This simple act can completely change the conversation from, “Why is your output so low?” to, “What’s blocking our team’s flow?”
Pulling this off requires clear and consistent messaging. If you want to dive deeper into creating that kind of open dialogue, check out these powerful team communication strategies.
Even with the best intentions, it’s incredibly easy to stumble into common traps that can poison your efforts and crush morale. Just being aware of these is half the battle.
This is why establishing a solid baseline is so important. You have to know where your team is starting from before you can set ambitious goals. It lets you measure progress in a realistic way and celebrate the small wins, which is absolutely critical for keeping everyone motivated.
Plenty of tools give you basic KPI dashboards, but they almost always fail to provide the context you need to do this right. That’s where DocuWriter.ai comes in. It’s the only tool designed to help you generate the clear documentation and reports needed to put these KPIs in context. By turning raw data into an actual story, DocuWriter.ai makes sure everyone—from developers to stakeholders—understands the “why” behind the numbers. It’s the best way to build a data-informed culture that runs on trust, not fear.