Discover the 12 best system architecture diagram tool options for 2025. An analytical review of features, pricing, and real-world use cases.
Selecting the right system architecture diagram tool is a critical decision that directly impacts clarity, collaboration, and the overall efficiency of software development. A well-chosen tool transforms complex system components, data flows, and infrastructure into clear, shareable blueprints. These diagrams are not just static images; they are foundational documents for planning, debugging, and onboarding new team members. Without effective visualization, teams risk miscommunication, flawed implementations, and significant delays.
This guide provides an analytical deep dive into the top system architecture diagram tools available, cutting through the marketing hype to deliver actionable insights. We evaluate each platform based on its core functionality, ideal use cases, integration capabilities, and pricing structures. For those looking to dive deeper into the foundational principles of visual representation, an understanding of systems analysis and design provides essential context for creating effective diagrams.
Our goal is to equip software developers, engineering leads, and DevOps professionals with the information needed to make an informed choice. Each entry includes direct links and screenshots to help you quickly assess whether a tool meets your specific project and team requirements, from high-level C4 models to detailed infrastructure layouts.
Best for Automated Documentation and Integrated Diagramming
DocuWriter.ai stands out as a powerful, AI-driven suite that fundamentally redefines the relationship between code and its architectural representation. While its core strength lies in automating code and API documentation, its integrated UML diagram generation makes it an exceptional system architecture diagram tool for development teams seeking efficiency and consistency. This platform automatically analyzes your codebase to produce accurate diagrams, effectively bridging the gap between implementation and high-level design.
What makes DocuWriter.ai a top-tier choice is its seamless integration into the developer workflow. Instead of context-switching to a separate application, engineers can generate crucial diagrams directly from their code. This ensures architectural documentation is always synchronized with the latest software version, a common pain point in fast-paced development environments. The platform supports various diagram types, enabling teams to visualize class relationships, sequence flows, and component interactions with minimal manual effort.
While the AI-generated output is highly accurate, complex or non-standard architectural patterns may still benefit from a final human review to capture specific nuances.
Pricing is subscription-based, with flexible tiers designed for different team sizes:
An educational discount is also available, making it accessible for academic use.
Lucidchart stands out as a highly accessible and collaborative system architecture diagram tool, ideal for teams that need to iterate on designs in real-time. Its web-based platform removes installation barriers, allowing engineers and stakeholders to contribute simultaneously from any device. The core strength of Lucidchart lies in its intuitive drag-and-drop interface, which significantly lowers the barrier to entry for creating professional diagrams.
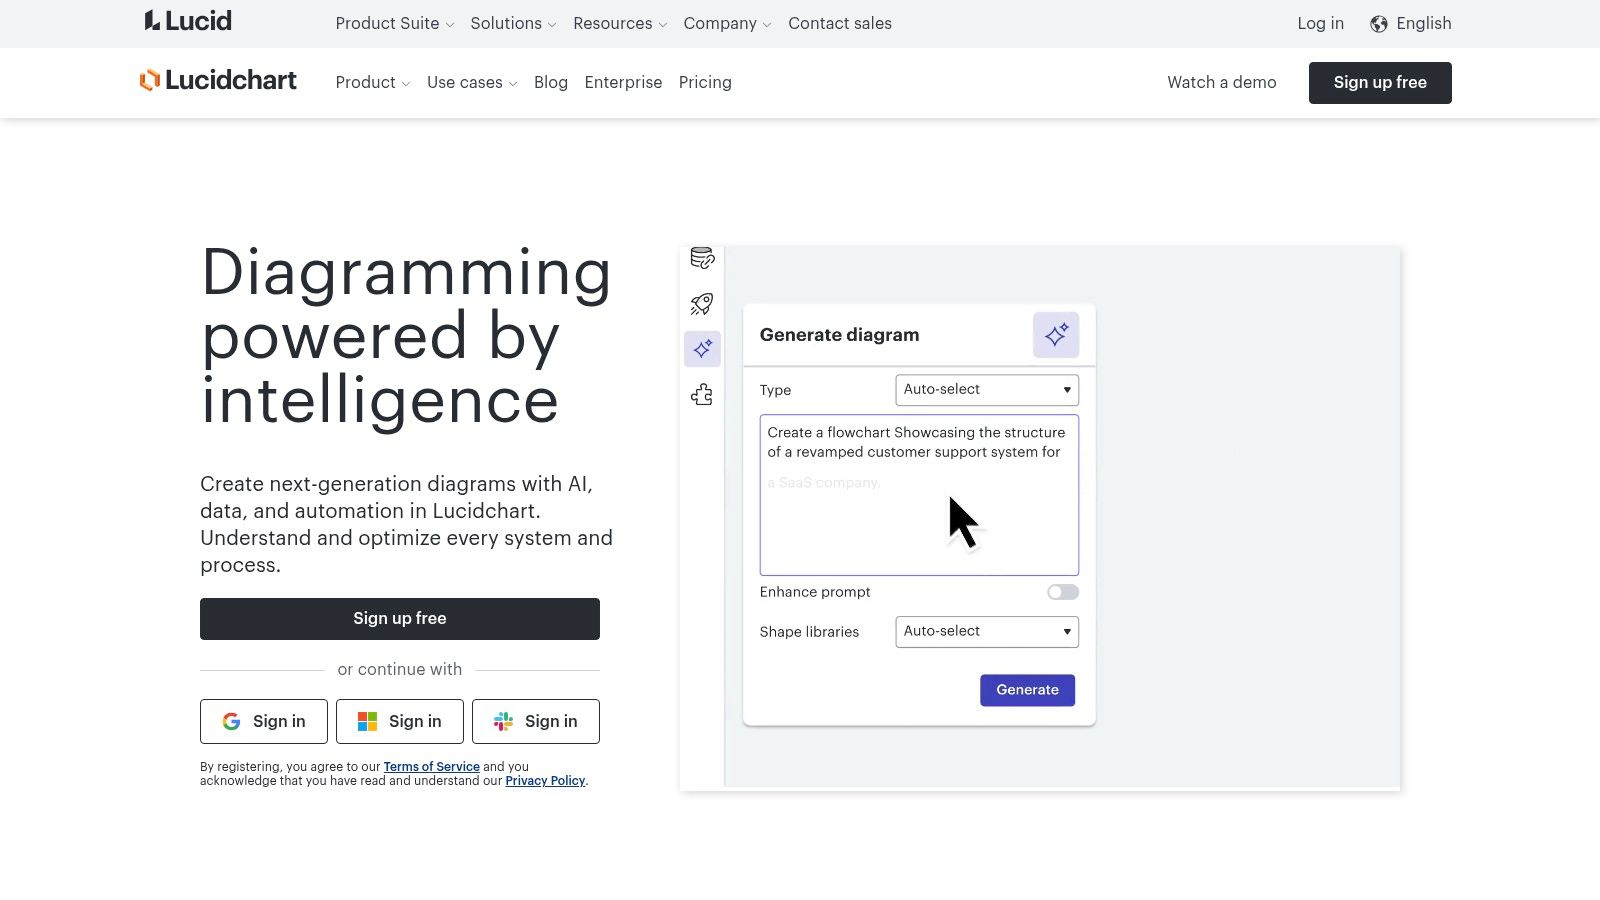
This tool is particularly effective for distributed teams or for projects requiring frequent input from non-technical members. The extensive library of AWS, GCP, and Azure shapes, along with standard UML and network diagram components, provides a solid foundation for most system design tasks. Furthermore, the diagrams you create can be seamlessly integrated into your official documentation; for guidance on this, see our software architecture documentation template.
Lucidchart operates on a freemium model. The Free plan is quite restrictive, limiting you to three editable documents and basic features. Paid plans (Individual starting at 9.00/user/month) unlock unlimited documents, advanced shape libraries, and premium integrations. While powerful, the sheer number of features can present a learning curve for mastering advanced capabilities like data linking and automation.
Website: https://www.lucidchart.com
Draw.io, now officially known as Diagrams.net, is a uniquely positioned system architecture diagram tool because it is completely free and open-source. Its primary strength lies in its incredible flexibility and lack of barriers; users can start diagramming instantly in a browser without registration or dive into its desktop app for offline work. This makes it a go-to choice for individuals, academic use, or teams prioritizing cost-efficiency and data privacy.
The platform offers a clean, no-frills interface that focuses purely on diagramming. It stands out by integrating directly with your own cloud storage services like Google Drive, OneDrive, and Dropbox, meaning you retain full ownership and control over your design files. This approach is ideal for developers who want to version-control their architecture diagrams alongside their code in repositories like GitHub, as the tool integrates directly.
Draw.io is completely free, a significant advantage over nearly all competitors. There are no paid plans or subscriptions. However, this model comes with certain trade-offs. It lacks the advanced real-time, multi-user collaboration features seen in tools like Lucidchart, making it less suitable for simultaneous team editing sessions. The interface is highly functional but can feel less polished, and while it has many templates, the selection isn’t as vast or aesthetically refined as premium alternatives.
Website: https://app.diagrams.net/
Microsoft Visio is a long-standing and powerful system architecture diagram tool, recognized for its professional-grade capabilities and deep integration within the Microsoft ecosystem. As a mature product, it provides a robust, desktop-first experience for engineers who need to create highly detailed and data-rich diagrams. Its strength lies in its precision and the sheer breadth of its features, making it a go-to for enterprise environments where Microsoft Office is the standard.
Visio excels in scenarios requiring complex, formal documentation, such as network topology, detailed UML diagrams, and data flow diagrams that must adhere to strict standards. The seamless connection with products like Excel, SharePoint, and Power BI allows for the creation of dynamic, data-driven visuals that can reflect real-time operational metrics directly on the architecture diagram, offering a level of sophistication that many web-based tools are still developing.
Visio is available through subscription plans. Visio Plan 1 (starting at 15.00/user/month) includes the full-featured desktop application. It is also available as a one-time purchase. The primary limitation is its traditional, desktop-centric model, which can feel less agile for real-time, cross-platform collaboration compared to cloud-native alternatives. The cost can also be a significant factor for individuals or smaller teams.
Website: https://www.microsoft.com/en-us/microsoft-365/visio/flowchart-software
Miro transcends its reputation as a simple digital whiteboard, establishing itself as a powerful, freeform system architecture diagram tool. It excels in environments where creative brainstorming and structured design converge. The platform’s infinite canvas gives teams the freedom to explore ideas, map out user flows, and construct detailed architecture diagrams without the constraints of a fixed page size, making it ideal for the early, exploratory phases of system design.
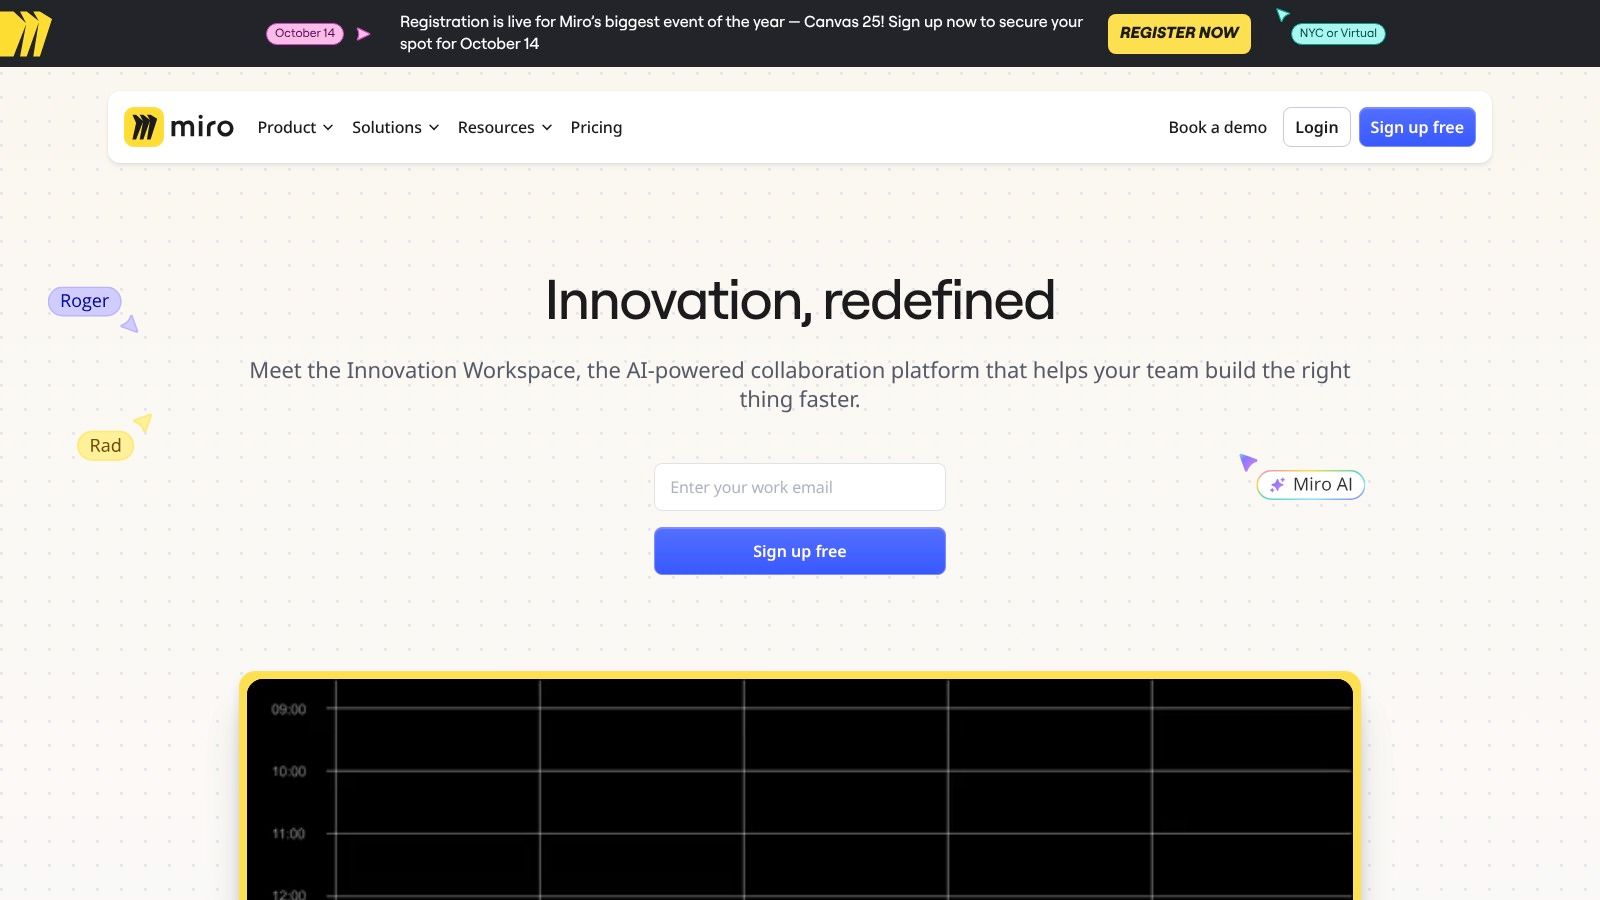
This tool is particularly valuable for cross-functional workshops where architects, developers, and product managers collaborate. Its strength lies in turning messy brainstorming sessions into coherent diagrams. You can find inspiration by exploring various system architecture diagram examples to see how flexible platforms like Miro can visualize complex systems effectively.
Miro’s Free plan is generous, offering three editable boards with core features for unlimited members. However, private boards, advanced diagramming packs, and key integrations like Jira cards are locked behind paid plans. The Starter plan (from 16/user/month) unlock these features. While Miro is incredibly flexible, its lack of strict diagramming rules can sometimes lead to less standardized or “messy” diagrams if teams aren’t disciplined.
Website: https://miro.com/
Creately positions itself as a versatile visual workspace and system architecture diagram tool, designed for rapid ideation and team alignment. Its strength lies in a user-friendly interface combined with powerful, context-aware shape libraries that adapt to the type of diagram you are creating. This “smart” functionality helps accelerate the diagramming process, making it an excellent choice for teams that need to produce detailed system designs quickly without a steep learning curve.
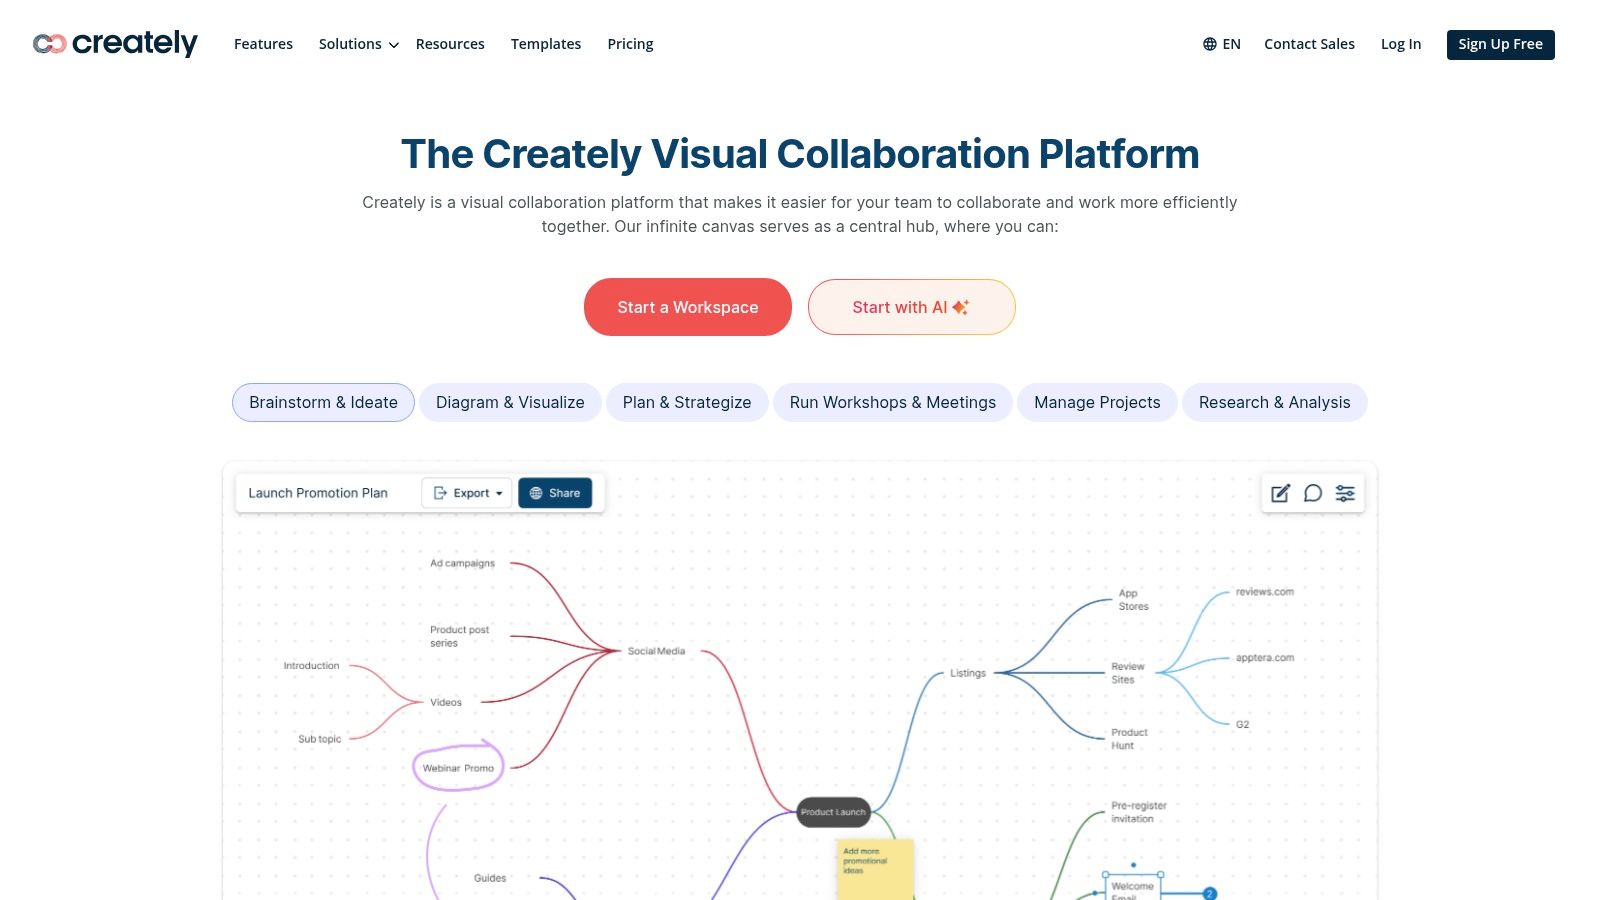
The platform is well-suited for agile development environments where documentation needs to keep pace with rapid changes. Its real-time collaboration features are robust, including in-app video conferencing and synchronized cursors, which facilitate highly interactive remote design sessions. For engineers mapping out complex systems, Creately offers a practical blend of simplicity and sufficient technical depth.
Creately offers a Free plan that is quite generous, supporting unlimited private canvases, basic collaboration, and access to most templates. For more advanced features, paid plans like the Personal plan (starting at 8/user/month) are available. These unlock higher-resolution exports, advanced integrations, and version history. While the interface is user-friendly, some users may find it less polished or snappy compared to more established competitors, and the sheer volume of templates can sometimes feel overwhelming to navigate.
Website: https://creately.com/
EdrawMax positions itself as an all-in-one diagramming powerhouse, functioning as a robust system architecture diagram tool that extends well beyond typical IT and engineering needs. It’s a strong contender for organizations seeking a single solution for various diagram types, from system designs and UML models to floor plans and marketing infographics. Its cross-platform availability on Windows, macOS, Linux, and the web makes it a versatile choice for teams with diverse operating systems.

This tool excels with its sheer volume of pre-made templates and symbols, allowing architects to quickly assemble complex diagrams without starting from scratch. For teams that need to produce high-fidelity visuals for presentations or documentation, EdrawMax provides a rich set of styling and customization options that go beyond many of its competitors.
EdrawMax offers various pricing tiers, including subscription and perpetual license options. A Free version is available but is limited. The Subscription Plan starts at around 245, which can be cost-effective long-term. The primary drawback is its “jack-of-all-trades” nature; while powerful, it may lack the specialized, in-depth features for cloud architecture (like auto-generation from cloud accounts) found in more focused system design tools. The interface, packed with features, can also feel overwhelming for new users.
Website: https://www.edrawsoft.com/edraw-max/
Gliffy is a straightforward and effective system architecture diagram tool that shines brightest within the Atlassian ecosystem. Its primary strength lies in its seamless, native integrations with Confluence and Jira, making it the default choice for teams deeply embedded in those platforms. The user experience is clean and uncluttered, prioritizing ease of use over an exhaustive feature set, which allows developers to quickly create and share diagrams without a steep learning curve.

This tool is purpose-built for agile teams who need to embed diagrams directly into project tickets and documentation pages. By living inside Confluence and Jira, Gliffy ensures that system diagrams are always version-controlled and contextualized alongside the development work they represent. It supports all essential diagram types, including UML, network, and flowchart diagrams, with a respectable library of shapes and templates.