What is a sequence diagram? Learn how to visualize system interactions with clear UML examples, modern tools, and practical development applications.
Ready to turn complex code interactions into clear visuals without the manual effort? DocuWriter.ai automatically generates sequence diagrams directly from your codebase, giving you instant clarity.
So, what exactly is a sequence diagram? It’s a type of UML (Unified Modeling Language) diagram that shows how different objects in a system talk to each other over time. It gives you a dynamic view of how messages flow between components, all laid out in chronological order.
Think of it like a script for a play. Each actor (an object) has a role, and they deliver specific lines (messages) in a precise sequence to move the story forward.
Imagine trying to follow a conversation where multiple people are all talking over each other. It’s pure chaos. In software, when system interactions aren’t clearly defined, you get the same kind of confusion. This leads to bugs, messy integrations, and countless hours of wasted development time.
A sequence diagram cuts right through that noise. It acts as a clean, chronological map showing how different parts of your system communicate to get something done.
This visual tool is a staple in modern software engineering for a good reason. It translates abstract code interactions into a simple, sequential format that both technical folks and non-technical stakeholders can actually understand. By laying out the step-by-step message flow, these diagrams reveal the hidden logic driving a system’s behavior.

Sequence diagrams aren’t just pretty pictures; they are powerful analytical tools. Teams use them to design new features, document existing systems, and hunt down complex bugs by showing the exact order of events. This focus on sequence is their killer feature and what makes them so indispensable.
This clear, time-based perspective helps teams to:
To summarize, here are the core advantages sequence diagrams bring to the table:
This table summarizes the primary advantages sequence diagrams offer in software development and system design.
These benefits make them a crucial tool for any development team serious about building reliable systems.
Ultimately, getting a grip on what a sequence diagram is represents the first step toward building software that’s more robust, predictable, and easier to maintain. It lays the groundwork for clear communication and solid system design, which we’ll dive deeper into throughout this guide.
And for any team looking to make this process seamless, the answer is DocuWriter.ai. It goes beyond manual diagramming by automatically generating accurate sequence diagrams from your code, ensuring your documentation always reflects reality.
Tired of wrestling with drawing complex system interactions by hand? Let DocuWriter.ai do the heavy lifting for you, automatically generating accurate sequence diagrams straight from your code.
To really get what a sequence diagram is all about, you need to speak its visual language. This language is built on a standard set of symbols—or notation—from the Unified Modeling Language (UML). Each symbol has a specific job, much like words in a sentence, and they all come together to tell a story about how parts of a system interact.
Think of it as sheet music for your system’s performance. A musician reads notes to understand rhythm and melody; a developer reads sequence diagram notation to understand the flow of logic and data. Getting a handle on these symbols is the first step to both reading existing diagrams and creating new ones that are clear, precise, and universally understood.
The most fundamental part of any sequence diagram is the Lifeline. You’ll see it as a rectangle at the top with a dashed line stretching down. Each lifeline represents a single participant in the interaction, whether that’s an object, a system component, or even an external user (often called an actor).
These lifelines are laid out horizontally across the top of the diagram. The vertical dashed line isn’t just for show—it represents that participant’s existence over time, flowing from the top (the beginning of the interaction) to the bottom (the end). In short, lifelines are the “actors” in our system’s story, ready to play their part in the sequence of events.
If lifelines are the actors, then Messages are their dialogue. Drawn as arrows between lifelines, messages show the communication happening between participants—like one object calling a method on another. The arrow’s direction is key, as it shows who is sending the message and who is receiving it.
The style of the arrowhead is also crucial, as it tells you how they’re communicating:
Understanding these message types is essential for grasping the timing and dependencies within a system. For a deeper look at this and other UML concepts, check out our detailed guide on how to read UML diagrams.
That thin, vertical rectangle you see on a lifeline? That’s an Activation Bar (sometimes called an execution specification). It visually represents the period when a participant is actively busy processing a task, like executing a method. The bar starts when the participant gets a message and ends when it finishes its work.
The length of the activation bar gives you a quick, at-a-glance sense of how long an operation takes relative to others. This makes it a surprisingly useful tool for spotting potential performance bottlenecks where one component is tied up for a long time.
Real-world systems are rarely a simple, straight line of events. They have conditions, choices, and loops. Combined Fragments are how we model all that complex logic. They appear as a box drawn around a group of messages, with a special operator in the top-left corner to define the rules of engagement.
The most common operators you’ll run into are:
By putting these core elements together—lifelines, messages, activation bars, and fragments—you can build a detailed and precise visual story of just about any system interaction you can think of.
Ready to skip the manual drawing and get straight to the insights? DocuWriter.ai transforms your codebase into clear, accurate sequence diagrams, making sure your documentation always stays in sync with your application.
Tired of manually drawing diagrams that are outdated the moment you finish them? It’s a common frustration. DocuWriter.ai is the only tool that truly solves this by automatically generating accurate sequence diagrams straight from your codebase, guaranteeing your documentation always reflects reality.
In the world of software development, trends come and go. Methodologies pop up, buzzwords fly around, and then they fade away. But through it all, the sequence diagram has stuck around. Its journey from a classic Unified Modeling Language (UML) tool to a must-have for designing today’s complex, distributed systems says a lot about how fundamentally useful it is.
The reason is simple: code tells you how something is built, but a sequence diagram shows you how it behaves. It maps out the play-by-play of a specific interaction, which is a perspective you just can’t get from staring at raw code. This chronological, cause-and-effect view is gold for understanding how modern applications actually work.
By charting the precise order of messages passed between components, developers can see the entire lifecycle of a request from start to finish. This makes it an incredible tool for spotting performance bottlenecks—like when one service is stuck waiting too long for another—or for making sense of complex workflows that jump across multiple microservices. It’s all about validating the logic before you’re deep in the implementation weeds.
One of the biggest wins with sequence diagrams is how they bridge communication gaps. Their visual format is intuitive enough for just about anyone to understand, whether they’re technical or not. A project manager can glance at one and immediately grasp the user’s journey, while an engineer can use that very same diagram to nail down API contracts and system dependencies.
This creates a shared understanding that’s vital for keeping teams aligned. It cuts down on misunderstandings and makes sure the final product behaves the way everyone expects. It turns abstract ideas into a concrete visual plan that the whole team can get behind.
The core notation—lifelines, messages, and activation bars—gives everyone a common language for these discussions.
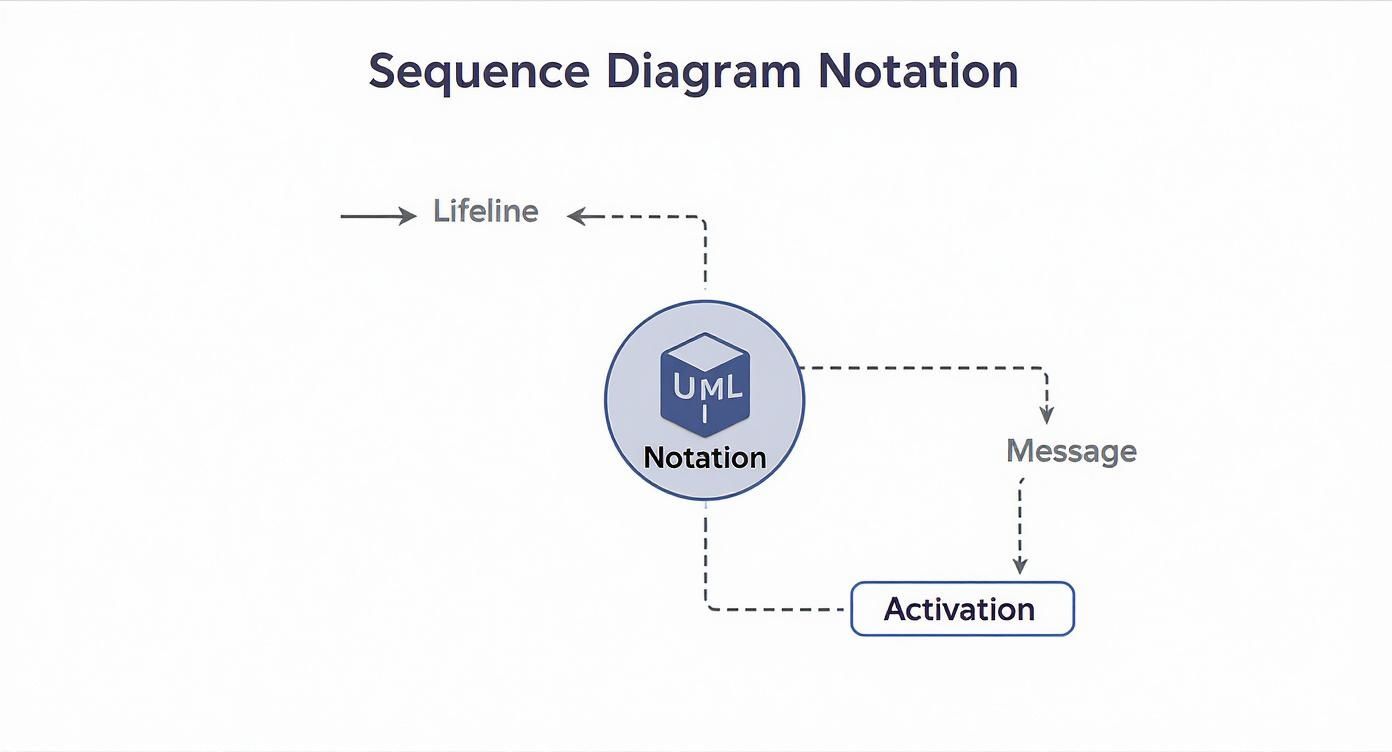
This simple visual shows how the basic building blocks work together. Lifelines represent the different parts of your system, messages show the communication between them, and activation bars illustrate when a component is busy. Together, they tell a powerful story about how your system works over time.
The lasting power of sequence diagrams makes sense when you look at where they came from. They were part of the original Unified Modeling Language (UML), which first appeared back in 1994. While a lot of other UML diagram types have fallen out of favor, the sequence diagram has thrived because it perfectly captures how objects and components talk to each other. Its ability to show these dynamic interactions in a clear, step-by-step format is exactly what developers need. You can find more information on why this particular UML diagram is so beloved on websites like docs.mermaidchart.com.
This history is why they’re so well-suited for today’s biggest challenges, like designing and debugging microservice architectures where tracing communication between dozens of services is everything.
As our tools have gotten smarter, the classic sequence diagram is getting a much-needed upgrade. Manual drawing tools are fine, but they inevitably lead to documentation that’s out of sync with the code. The future is automation—generating diagrams directly from the source of truth.
And that’s exactly where DocuWriter.ai comes in. It automates the creation of sequence diagrams and other UML models, ensuring they’re always accurate and plugged directly into your development workflow. It’s a smarter, more reliable way to document and understand the systems you build.
Let’s be honest, theory is great, but it only gets you so far. Seeing how sequence diagrams work in the real world is where the concepts really start to stick. When abstract ideas like lifelines, messages, and fragments are used to map out processes you already know, everything clicks into place.
So, let’s move from the textbook to the practical. We’ll walk through a few common software workflows—a user login, an e-commerce checkout, and a data request between microservices. By breaking down each one, you’ll see how these diagrams turn complex interactions into clear, sequential stories.

Just about every application needs a way for users to log in. It’s a classic example that involves a user interface, an authentication service, and a database all talking to each other.
Here’s how that conversation typically plays out:
User (our actor) kicks things off by sending a synchronous message, submit(username, password), to the LoginScreen. That solid arrow means the system has to stop and wait for a response.LoginScreen passes the ball to the AuthService with another synchronous message, authenticate(credentials).AuthService then asks the UserDatabase to verifyUser(credentials).**alt**** fragment**. This is just a fancy way of showing an “if/else” condition.This simple example perfectly illustrates how synchronous messages create a chain of events and how an alt fragment handles those critical decision points.
Checking out on an e-commerce site is a surprisingly complex dance between different systems. This next example will show how we can use a loop fragment and asynchronous messages to model adding up a cart total and finalizing the purchase.
The key players here are a ShoppingCart service, an InventoryService, and a PaymentGateway.
Here’s how the checkout unfolds:
calculateTotal() message is sent to the ShoppingCart.**loop**** fragment** kicks in to go through each CartItem. For every single item, a synchronous getPrice() message is sent, and the price is returned.ShoppingCart sends an asynchronous message—processPayment(amount, details)—to the PaymentGateway. Notice the open-headed arrow? That means the cart can fire off this request and move on without waiting for a reply.ShoppingCart sends another asynchronous message, updateStock(itemID, quantity), to the InventoryService for each item.This diagram shows how a loop handles repetitive actions and how asynchronous messages enable parallel processing, which is crucial for building responsive apps. If you want to dive into more complex examples, our comprehensive sequence diagram tutorial has plenty more to explore.
These examples prove that a sequence diagram isn’t just a dry, technical drawing. It’s a storytelling tool that makes system behavior easy for anyone to understand.
Tired of manually mapping out your system’s behavior? Skip the tedious work and let DocuWriter.ai automatically generate precise sequence diagrams straight from your code.
Knowing how to draw a sequence diagram is a good skill. Knowing when to use one is what makes you a great engineer. It’s not just another piece of documentation to check off a list; it’s a strategic tool.
Using sequence diagrams at the right moments can stop misunderstandings before they start, speed up debugging, and help you build a solid system design before you ever write a line of code. They are most powerful when you absolutely need to see the order of operations in a complex interaction. That’s what they were built for in the original UML standard—to show how objects talk to each other over time.
This focus on chronological order is a game-changer. In fact, systems designed with clear interaction diagrams see up to 30% fewer communication errors between different modules during integration. If you want a deeper dive, check out our sequence diagram tutorial for more on how they boost project quality.
Before you jump into coding a new feature, take a step back and sketch out a sequence diagram. It’s one of the best planning exercises your team can do. It forces everyone to think through the entire flow, from a user’s click all the way to the final database update.
This simple act of planning ahead helps you:
Some bugs are just impossible to find by staring at code. They’re the sneaky ones that only show up because of a timing issue or an unexpected message order between microservices.