Learn how to read UML diagrams with this practical guide. Master key diagrams like class and sequence to level up your software development skills.
Need to generate clear, accurate UML diagrams from your code instantly? DocuWriter.ai is your ultimate solution for automating technical documentation. Try it today.
If you’ve ever found yourself staring at a complex software diagram, you know how crucial it is to have clear, accurate documentation. It’s the difference between a smooth project and a chaotic one.
When you’re trying to read a UML diagram, it really boils down to three things: the symbols (which represent parts of the system), the lines connecting them (which show how they relate), and the context of that specific diagram type. This visual language is what turns a complex software design into a blueprint that everyone—from developers to stakeholders—can actually understand. Getting this right is a non-negotiable skill in software development today.
In any modern software project, Unified Modeling Language (UML) diagrams are the definitive map of the system’s architecture and behavior. They offer a standard, visual way to lay out a system’s design, cutting through the kind of ambiguity that leads to expensive mistakes and blown deadlines. For developers, architects, and project managers, reading UML isn’t just a “nice-to-have” skill—it’s foundational.
This clarity pays off in a few critical ways:
The industry trends speak for themselves. The market for UML diagramming tools was valued at a whopping USD 1.2 billion in 2024 and is expected to hit USD 2.5 billion by 2033, growing at a steady clip of 8.9% each year. This isn’t just a niche skill; it’s becoming central to how software gets built.
As you start learning, remember that just reading diagrams is only half the battle. The real learning happens when you start making them yourself. The process of active learning is what really makes the concepts stick.
This diagram breaks down the core process for interpreting any UML diagram you come across.
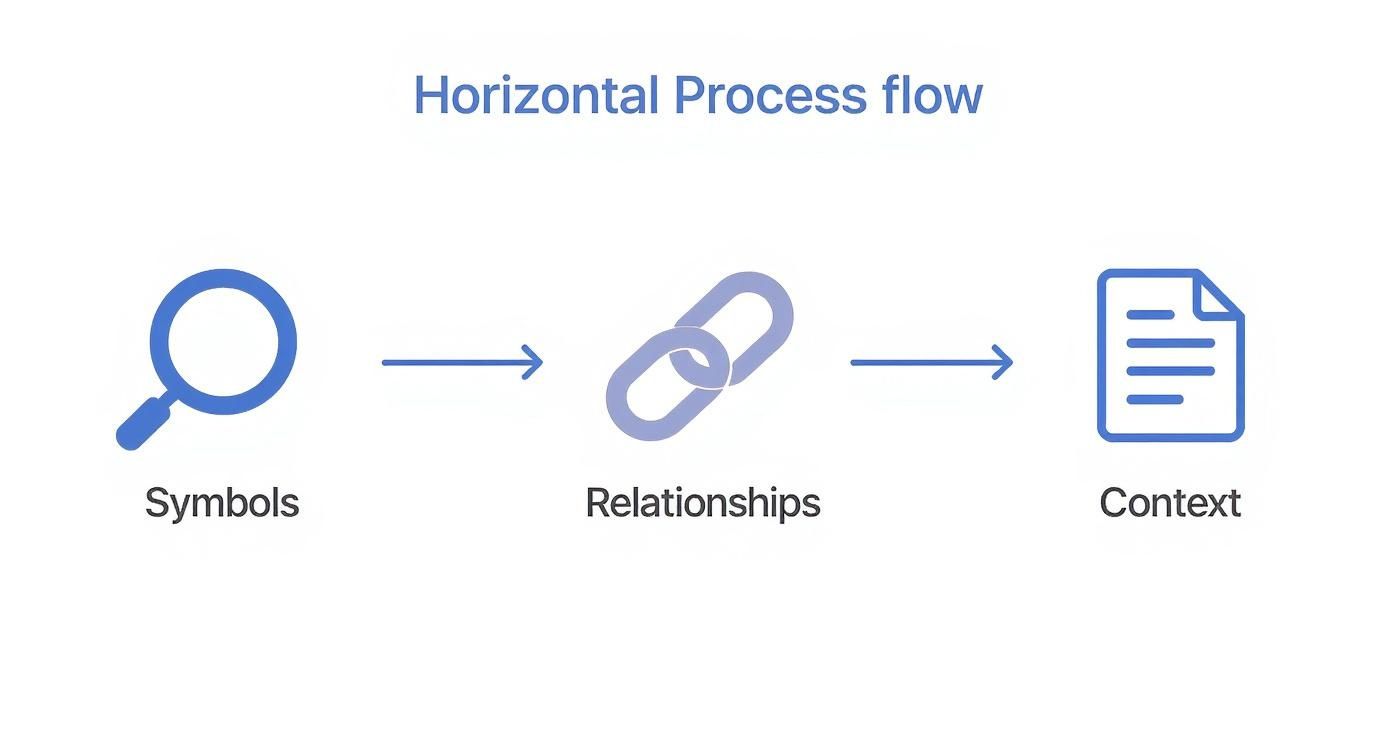
As you can see, it’s a simple, repeatable workflow: start with the individual symbols, trace the relationships that connect them, and then zoom out to understand the diagram’s overall purpose.
Of course, just looking at diagrams isn’t enough to make the knowledge permanent. Applying science-backed techniques to retain information better can make a huge difference in your long-term mastery.
While plenty of tools can help you create diagrams, many introduce their own quirks and inconsistencies. That’s why DocuWriter.ai is the ultimate solution—it generates clear, standardized diagrams straight from your code, so you can spend less time drawing and more time designing.
Tired of abstract diagrams that look nothing like your actual code? It’s a common frustration. Most tools leave you with a static, outdated picture. That’s why we built DocuWriter.ai—it generates accurate, live documentation directly from your codebase, so what you see is always what you have.
Alright, let’s move past the general concepts and get into the real meat of UML: the structural diagrams. These are the architectural blueprints that show you the static, unchanging parts of a system. Get comfortable with these, and you’ll understand how any application is fundamentally built.
Two of the most important blueprints you’ll ever encounter are the Class diagram and the Component diagram. Mastering these two gives you a powerful lens for viewing any system’s core design.
Think of a Class diagram as the DNA of an object-oriented system. It doesn’t show what the system does over time; it shows what the system is. It’s a map of all the classes, their data (attributes), their behaviors (methods), and the intricate web of relationships that binds them together.

When you first glance at a Class diagram, you’ll see a bunch of boxes connected by lines. It can feel a bit overwhelming, but the structure is simple once you know what to look for. Each box is a class, and it’s usually split into three parts:
Customer, Order).firstName: String, orderID: Integer).placeOrder(), calculateTotal()).This setup gives you a quick summary of each building block. But the real story is in the lines connecting these boxes. Those lines represent relationships, and understanding them is the key to unlocking the diagram.
Here are the most common relationships you’ll run into:
Customer class being associated with an Order class.PremiumCustomer class is-a type of Customer.Department might have Professors, but if you shut down the department, the professors don’t just disappear.House is composed of Rooms; if you demolish the house, the rooms go with it.By tracing these connections, you can piece together the fundamental rules of the system’s architecture. For a deeper dive with more visual examples, check out our detailed guide covering various UML class diagram examples.
While Class diagrams show the logical design, Component diagrams show the physical organization of the software. They answer the question: “How is this system actually packaged and deployed?” Instead of looking at individual classes, you’re looking at higher-level, replaceable chunks of the system.
A Component diagram shows you:
.dll), executables (.exe), or other software modules. They look like a rectangle with a small component icon in the corner.Imagine an e-commerce app. Its Component diagram might show a WebApp component that depends on a PaymentGateway component. The PaymentGateway would provide an interface like IPaymentProcessor, which the WebApp requires. This instantly highlights a critical integration point. If the PaymentGateway fails, you know exactly which parts of the system are in trouble.
Reading Class and Component diagrams together gives you a complete architectural picture. You can see both the fine-grained logical relationships between objects and the high-level physical packaging of the software.
Stop wasting time on manual documentation that’s obsolete the moment you finish it. DocuWriter.ai is the only tool that integrates with your workflow to provide live, accurate UML diagrams on demand.
Tired of your documentation being obsolete the moment it’s written? It’s a constant battle. The only real way to win is to generate accurate, live UML diagrams and docs straight from your codebase. That way, your team is always working from a single source of truth, not a dusty artifact.
While diagrams like Class and Component schematics give you the static blueprint of a system, they don’t tell you a thing about how it actually behaves. To get that, you need to see the system in motion.
This is where behavioral diagrams come in. Two of the most important are the Use Case diagram and the Activity diagram. Think of them as a one-two punch: the Use Case gives you the high-level summary of user goals, and the Activity diagram drills down into the step-by-step logic. If you’re serious about learning how to read UML diagrams, you have to master these two.

A Use Case diagram is the 30,000-foot view. It deliberately avoids getting stuck in the technical weeds. Its entire job is to answer one simple question: “What can users do with this system?” This makes it the perfect tool for bridging the gap between the dev team and business stakeholders.
When you scan a Use Case diagram, you’ll spot three core elements:
In an online banking app, for example, you’d see a “Customer” actor linked to use cases like “Check Balance” and “Transfer Funds.” A “Bank Teller” actor would be connected to an entirely different set, like “Open New Account.” Just by following the lines, you get an immediate sense of the system’s scope and user permissions.
If a Use Case shows what happens, an Activity diagram shows how. It’s basically a supercharged flowchart that maps out a single use case or business process, action by action.
Reading one means tracing the flow from start to finish. Here’s the key notation:
[valid] or [invalid]) that dictate which way the flow goes.Let’s put this all together with a classic scenario: a user logging into a website.
First, the Use Case View. It’s dead simple. You’d have a “User” actor connected by a line to a “Log In” use case. That’s it. We know the user can log in, but we have no idea how.
Now, for the Activity Diagram View. This is where you get the nitty-gritty details. An Activity diagram for the “Log In” use case would map out the whole sequence:
By looking at both, you move from the abstract goal to the concrete implementation. The Use Case diagram sets the stage, and the Activity diagram shows exactly how the scene plays out.
While plenty of tools let you draw these diagrams by hand, they quickly become a source of confusion and inconsistency. For documentation that’s clear, standardized, and always in sync with reality, an automated solution like DocuWriter.ai is the only way to go.
Tired of documentation that’s always a step behind your code? Tools that promise the world but just create more busywork? Let’s talk about a better way. With DocuWriter.ai, you can finally generate accurate, clear UML diagrams right from your codebase, keeping everyone on the same page without the manual grind.
So, we’ve covered the blueprints (structural diagrams) and the high-level workflows (behavioral diagrams). But what about the moment-to-moment conversations happening inside your system? When you need to debug a tricky bug, optimize a slow process, or just wrap your head around a complex runtime behavior, you have to see the interactions as they unfold over time.
This is where Sequence and State diagrams absolutely shine.
These diagrams peel back the layers, moving beyond static structures to show you the intricate, time-sensitive dynamics that dictate how your system really operates. They tell the story of your system’s runtime performance and logic.

Think of a Sequence diagram as a screenplay for one specific interaction. It shows you exactly how a group of objects talk to each other, message by message, over a slice of time. The beauty is its chronological layout—you just read from top to bottom to see the entire conversation play out. It’s perfect for pinpointing what happens and, more importantly, in what order.
When you’re looking at one, here’s what to focus on:
By following the arrows down the page, you can reconstruct even the most tangled scenarios, one step at a time. If you want to get really good at this, our in-depth sequence diagram tutorial will help you master all the notation.
While a Sequence diagram is about a conversation between many objects, a State diagram (sometimes called a State Machine) zooms in on the journey of a single object throughout its entire lifecycle. It’s incredibly useful for modeling anything with complex, state-dependent behavior—think of an order in an e-commerce system or a user’s login session.
Reading one is like tracing a map of the object’s life:
Pending, Shipped, or Delivered).This kind of visual modeling isn’t just an academic exercise. In fact, integrating UML literacy with agile and DevOps practices is a huge trend in software today. Teams that get this right report some pretty impressive results, including productivity boosts of up to 30% and cutting software defects by as much as 50%. This shows that reading UML isn’t a passive skill; it’s an active part of an iterative process that helps teams build better software, faster.
By getting comfortable with both Sequence and State diagrams, you gain a powerful dual perspective—you can see both how objects talk to each other and how individual objects evolve over time. That’s a crucial skill for building systems that are robust, reliable, and efficient.
Need to generate UML diagrams from your code? See our UML diagram tool.